How Can We Help?
Campaign analysis – Overview tab
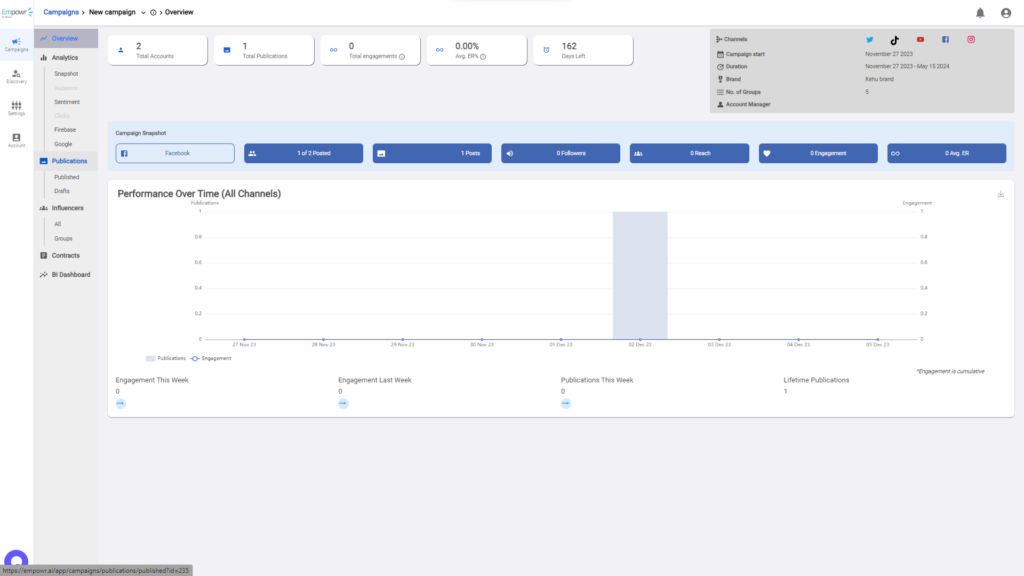
- Overview page of the campaign analysis, presents the big picture of the campaign. From the campaign start to the present date of viewing.
- In the top left we can see aggregate numbers of:
- Total accounts – These are the individual accounts that are contributing to the campaign directly.
- Total posts – The posts made and linked to the platform for the campaign.
- Total engagements – Any interaction to the posts or because of the post, for example profile visits, will be accounted for here.
- Average engagement rate – Average engagement rate across all platforms related to the campaign.
- Days left – From today, how many more days do you have to run the campaign.
- We also have a card on the top right showing important details of the campaign.
- Campaign snapshot – This section focuses on presenting information about the social media platforms involved and their impact to the campaign.
- Performance over time graph
- This an hover interactive graph that shows performance of the campaign against posts’ publication and engagement made.
- This information is represented on a monthly timeline.
- Below the graph, we have the weekly activity update. Engagement of this week and last week and publication made this week and lifetime (campaign duration up to current date).