How Can We Help?
Campaign analysis – Analytics tab
In the analytics tab there are 4 section of information analytics
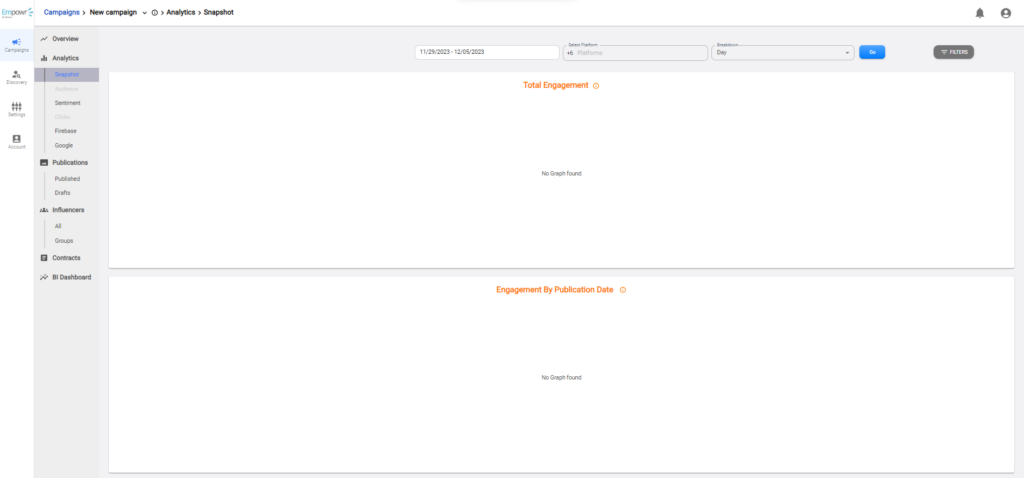
Total Engagement
- This is a graph displays all the engagement on all posts by platform across the campaign relative to the filters set.
- You can change the graph format or download the graph image via the options shown on the top right of the graph.
Engagement by publication date
- Displays how the level of engagement with publication changes over time since its publication. Indicating how user interactions evolve as the content becomes older on the specific platform.
- This graph is subject to the filter put in place.
- You can change the graph format or download the graph image via the options shown on the top right of the graph.
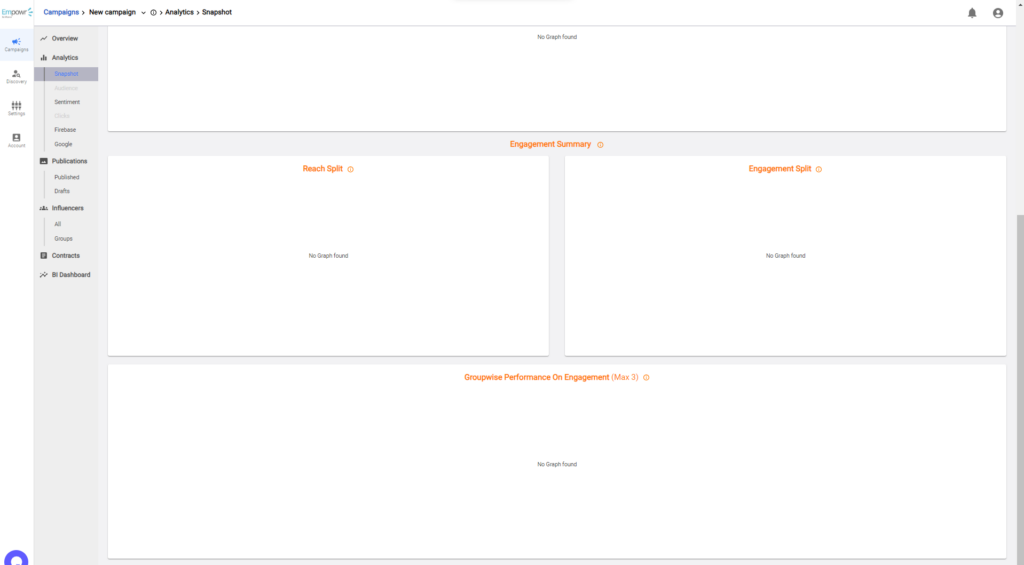
Engagement summary
- Engagement summary breaks down each platform contribution to the overall campaign performance.
- In the first section, there is a break down of the actual metrics we track from each social media that your influencers published to and the numbers captured.
In this section, we have the split graphs:
- Reach split
- Displays the split reach of your publications by platform across the campaign.
- This is only tracked for Instagram, YouTube, TikTok and Twitter
- Engagement split
- Displays the split engagement of your publications by platform across the campaign.
Groupwise performance in engagement
- Considering, influencers are grouped by social media by default.
- We are able to calculate and display attribution by the groups created.
- You can change the graph format or download the graph image via the options shown on the top right of the graph.
Filters
- There are two types of filters to this page
- Primary
- Includes dates, platform and breakdown.
- Secondary
- They are exposed by tapping on the filter button at the top right
- Includes: Groups and influencer filter.
- Primary